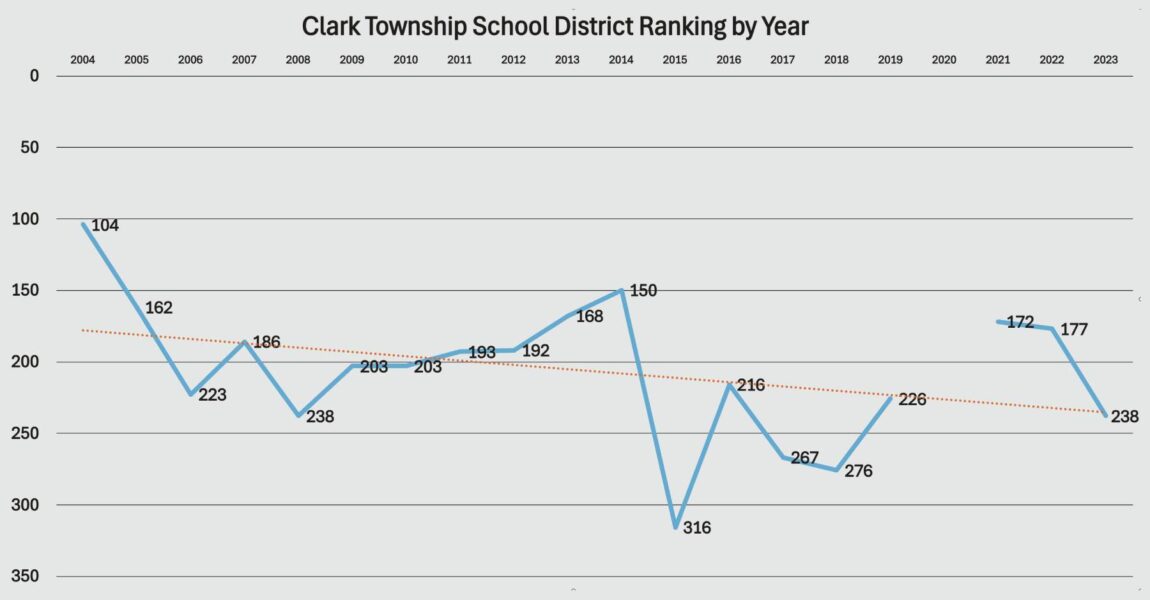
The Clark, NJ School District, which includes Arthur L. Johnson High School, Carl H. Kumpf Middle School, and the elementary schools in the area, has seen a lot of changes in its overall performance over the years. By examining the district’s rankings from 2004 to 2023, we can identify trends, understand what led to improvements or declines, and discuss what can be done to keep the district moving in the right direction.
Let’s take a closer look at the ranking data and trends.
| Year | NJ State Rank |
|---|---|
| 2004 | 104 |
| 2005 | 162 |
| 2006 | 223 |
| 2007 | 186 |
| 2008 | 238 |
| 2009 | 203 |
| 2010 | 203 |
| 2011 | 193 |
| 2012 | 192 |
| 2013 | 168 |
| 2014 | 150 |
| 2015 | 316 |
| 2016 | 216 |
| 2017 | 267 |
| 2018 | 276 |
| 2019 | 226 |
| 2020 | |
| 2021 | 172 |
| 2022 | 177 |
| 2023 | 238 |
This data comes from schooldigger.com
District Ranking Trends Over Time
- 2004-2006: The Clark School District started off strong in 2004 with a ranking of 104th out of all the school districts in New Jersey. This placed the district near the top, with a solid performance overall. However, in the following years, the ranking dropped. In 2005, the district fell to 162nd place, and by 2006, it dropped further to 223rd. This indicates a steady decline over these years, suggesting some struggles within the schools during this period.
- 2007-2009: Starting in 2007, the district saw some improvements. It climbed back up to 186th place in 2007, then to 203rd in both 2009 and 2010. While this was an improvement from the earlier drop, the district still hovered around the middle of the rankings, performing just about average compared to other school districts in New Jersey.
- 2010-2014: During this period, the Clark School District experienced gradual improvements in its ranking. In 2011, the district ranked 193rd, and in 2012, it improved again to 192nd place. By 2013, the district had climbed to 168th place, and by 2014, it reached 150th, showing steady progress. This period of improvement suggests that the schools in Clark were making significant gains in performance.
- 2015: A Sharp Decline: In 2015, the district experienced a major drop, falling all the way to 316th place. This was the lowest ranking the district had seen in over a decade, indicating that something had changed in the district’s performance. This decline likely reflects challenges faced across the schools, including adjustments to the new, more difficult PARCC standardized test that was introduced around this time.
- 2016-2019: Gradual Recovery: After the sharp decline in 2015, the district started to recover. In 2016, the district climbed to 216th place, and by 2019, it had risen to 226th place. Although still not as high as the rankings from the early 2010s, the district showed signs of improvement after its tough year in 2015.
- 2021-2023: Mixed Results: In 2021, the Clark School District made a big leap forward, rising to 172nd place. This was the best performance in several years. However, in the following years, the district experienced a drop again, ranking 177th in 2022 and falling to 238th place in 2023. This suggests that while the district made some gains, it struggled to maintain consistency.
What Caused the Changes in Rankings?
There are several factors that likely contributed to the changes in the district’s rankings over the years:
- Introduction of PARCC Testing (2015): In 2015, New Jersey introduced a new standardized test, the PARCC test, which was more challenging than previous tests. Many school districts, including Clark, struggled to adapt to the new format, leading to lower test scores and a significant drop in rankings for the district in that year.
- Test Scores: As with individual schools, the overall ranking of a district is heavily influenced by how well students perform on standardized tests in subjects like math, reading, and science. When test scores go down, the district’s ranking follows.
- School Performance: The overall performance of individual schools within the district, such as Arthur L. Johnson High School and Carl H. Kumpf Middle School, directly impacts the district’s ranking. Years when these schools performed well, such as 2004-2014, helped raise the district’s overall ranking, while declines in these schools, like in 2015, dragged the district down.
- Resources and Funding: Schools that have more resources, smaller class sizes, and more support for teachers tend to perform better. If the district faced any budget cuts or changes in funding during certain years, this could have impacted the performance of its schools.


