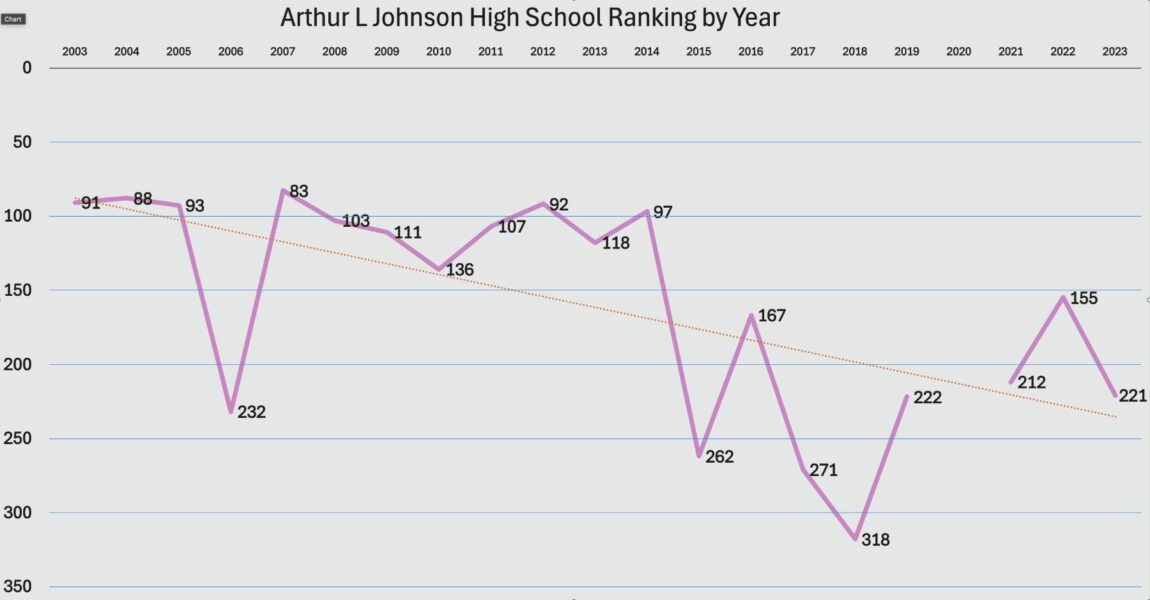
Arthur L. Johnson High School in Clark, NJ, has experienced a lot of changes in its statewide rankings over the past two decades. While it once ranked among the top schools, it has seen both good years and tough times. Let’s take a look at the numbers, understand what goes into these rankings, why they may have dropped in some years, and what we can do to get the school back on top.
Rank History for all students at Arthur L. Johnson High School
| Year | Avg Standard Score | Statewide Rank | NJ State Percentile |
|---|---|---|---|
| 2003 | 74.62 | 91st | 73.5% |
| 2004 | 74.82 | 88th | 74.7% |
| 2005 | 74.70 | 93rd | 73.5% |
| 2006 | 52.58 | 232nd | 35.0% |
| 2007 | 76.62 | 83rd | 77.0% |
| 2008 | 73.58 | 103rd | 71.3% |
| 2009 | 72.54 | 111th | 70.0% |
| 2010 | 67.05 | 136th | 63.3% |
| 2011 | 73.46 | 107th | 71.7% |
| 2012 | 74.15 | 92nd | 76.3% |
| 2013 | 71.60 | 118th | 70.2% |
| 2014 | 74.10 | 97th | 76.4% |
| 2015 | 33.58 | 262nd | 35.5% |
| 2016 | 48.75 | 167th | 59.2% |
| 2017 | 30.79 | 271st | 34.1% |
| 2018 | 24.71 | 318th | 23.4% |
| 2019 | 39.01 | 222nd | 46.6% |
| 2021 | 38.26 | 212th | 47.7% |
| 2022 | 49.37 | 155th | 62.7% |
| 2023 | 37.87 | 221st | 47.6% |
This data comes from schooldigger.com
In 2003, Arthur L. Johnson High School was ranked 91st out of 343 high schools in New Jersey, placing it in the top 25% of schools. Over the next several years, the school generally stayed near the top, with a ranking as high as 83rd in 2007. However, the school faced some big challenges starting in 2015. By 2017, the ranking had dropped to 271st out of 411 schools, placing it in the bottom third. Although the school has improved somewhat since then, with a ranking of 155th in 2022, it’s clear that there’s still work to be done to get back to the top.
Strong Start, Then a Big Drop (2003-2006)
- 2003-2005: Arthur L. Johnson High School started off very strong in the early 2000s. In 2003, the school ranked 91st out of 343 high schools, which placed it in the 73.5 percentile. This means the school was performing better than almost 75% of all high schools in New Jersey. In the next two years, the school’s ranking stayed solid, with a ranking of 88th in 2004 and 93rd in 2005, showing consistency in its performance.
- 2006: However, something happened in 2006 that caused the school’s ranking to drop sharply. That year, the school fell to 232nd place out of 357 schools, dropping all the way down to the 35.0 percentile. This means the school was now performing worse than over half of the high schools in New Jersey. This was a major drop from its earlier strong rankings.
A Bounce Back (2007-2012)
- 2007: After the big drop in 2006, Arthur L. Johnson High School made a comeback in 2007, rising to 83rd place out of 361 schools, landing in the 77.0 percentile. This was an impressive recovery, showing that the school worked hard to improve its performance.
- 2008-2012: Over the next several years, the school remained steady, performing better than most high schools in the state. In 2008, the school ranked 103rd, and in 2009, it was 111th. By 2012, Arthur L. Johnson had climbed back up to 92nd place, putting it in the 76.3 percentile. This showed that the school was consistently above average compared to other high schools in New Jersey.
Struggles Return (2013-2019)
- 2013-2014: While the school stayed strong in the early 2010s, there were signs of struggles again. In 2013, the school ranked 118th out of 396 schools, with a 70.2 percentile, and by 2014, the school ranked 97th, putting it in the 76.4 percentile. This was still a strong performance, but not quite as high as before.
- 2015: In 2015, the school faced another big drop, ranking 262nd out of 406 schools, landing in the 35.5 percentile. This was another sharp decline, similar to what happened in 2006. Something significant had changed, and it was clear the school was struggling again.
- 2016-2019: After the steep drop in 2015, the school started to recover. In 2016, Arthur L. Johnson climbed to 167th place, reaching the 59.2 percentile. However, in 2017, the school dropped again to 271st place, putting it in the 34.1 percentile. By 2019, the school ranked 222nd, showing some improvement but still not back to its earlier strength.
Recent Performance (2021-2023)
- 2021: Arthur L. Johnson High School’s performance improved slightly by 2021, when it ranked 212th out of 405 schools, placing it in the 47.7 percentile. While this was an improvement, the school was still ranked below average compared to other schools in the state.
- 2022-2023: In 2022, the school improved significantly, rising to 155th place, reaching the 62.7 percentile. However, by 2023, the school dropped again to 221st place, placing it in the 47.6 percentile. This shows that while the school has made efforts to improve, it continues to face challenges in maintaining its performance.
What Do These Rankings Tell Us?
The rankings for Arthur L. Johnson High School show that the school has had periods of strong performance followed by sharp declines. The data suggests that the school was doing well in the early 2000s, but faced significant challenges in 2006 and again in 2015. These drops were followed by periods of recovery, but the school has struggled to regain the high rankings it held in the early 2000s.


